using R to generate real-time covid-19 evolution graphs
R script to generate real-time covid-19 evolution graphs of cases and deaths (7 days moving average)
library(ggplot2)
require(plyr)
countrySelected = "Spain"
get.spline.info <- function(object) {
data.frame(x=object$x,y=object$y,df=object$df)
}
covidData <- read.csv('https://opendata.ecdc.europa.eu/covid19/casedistribution/csv', header=TRUE, sep=",")
covidReshaped <- subset(covidData, year!="2019",select=c(dateRep,cases,deaths,countriesAndTerritories,popData2019,continentExp))
covidReshaped$date <- as.Date(covidReshaped$dateRep,format='%d/%m/%y')
covidReshaped$daysFrom2020 <- (as.numeric(as.POSIXct(covidReshaped$date, format="%Y-%m-%d"))-1577836800)/86400 # calcula dies desde 1/1/2020
covidReshaped <- subset(covidReshaped, select = -dateRep ) # elimina dateRep
covidReshaped$deathsPer100K <- (covidReshaped$deaths/covidReshaped$popData2019)*100000
covidReshaped$casesPer100K <- (covidReshaped$cases/covidReshaped$popData2019)*100000
covidReshaped$movingAverageCases <- c(0)
covidReshaped$movingAverageDeaths <- c(0)
covidSubsetByCountry <- subset(covidReshaped,countriesAndTerritories==countrySelected)
for (row in 1:nrow(covidSubsetByCountry)) {
country <- covidSubsetByCountry[row,"countriesAndTerritories"]
day <- covidSubsetByCountry[row,"daysFrom2020"]
deathsX100K <- covidSubsetByCountry[row,"deathsPer100K"]
casesX100K <- covidSubsetByCountry[row,"casesPer100K"]
if (day > 7) {
maL1 <- subset(covidSubsetByCountry, daysFrom2020==day-1)
maL2 <- subset(covidSubsetByCountry, daysFrom2020==day-2)
maL3 <- subset(covidSubsetByCountry, daysFrom2020==day-3)
maL4 <- subset(covidSubsetByCountry, daysFrom2020==day-4)
maL5 <- subset(covidSubsetByCountry, daysFrom2020==day-5)
maL6 <- subset(covidSubsetByCountry, daysFrom2020==day-6)
maL7 <- subset(covidSubsetByCountry, daysFrom2020==day-7)
maCases <- (maL1$casesPer100K+maL2$casesPer100K+maL3$casesPer100K+maL4$casesPer100K+maL5$casesPer100K+maL6$casesPer100K+maL7$casesPer100K)/7
maDeaths <- (maL1$deathsPer100K+maL2$deathsPer100K+maL3$deathsPer100K+maL4$deathsPer100K+maL5$deathsPer100K+maL6$deathsPer100K+maL7$deathsPer100K)/7
if (length(maCases)>0) {
covidSubsetByCountry[row,"movingAverageCases"] <- maCases
}
if (length(maDeaths)>0) {
covidSubsetByCountry[row,"movingAverageDeaths"] <- maDeaths
}
}
}
splineCases <- smooth.spline(x=covidSubsetByCountry$daysFrom2020,y=covidSubsetByCountry$movingAverageCases,df=15)
splineDeaths <- smooth.spline(x=covidSubsetByCountry$daysFrom2020,y=covidSubsetByCountry$movingAverageDeaths,df=15)
spCases <- ldply(list(splineCases),get.spline.info) # convert the spline into dataframe (?)
spDeaths <- ldply(list(splineDeaths),get.spline.info) # convert the spline into dataframe (?)
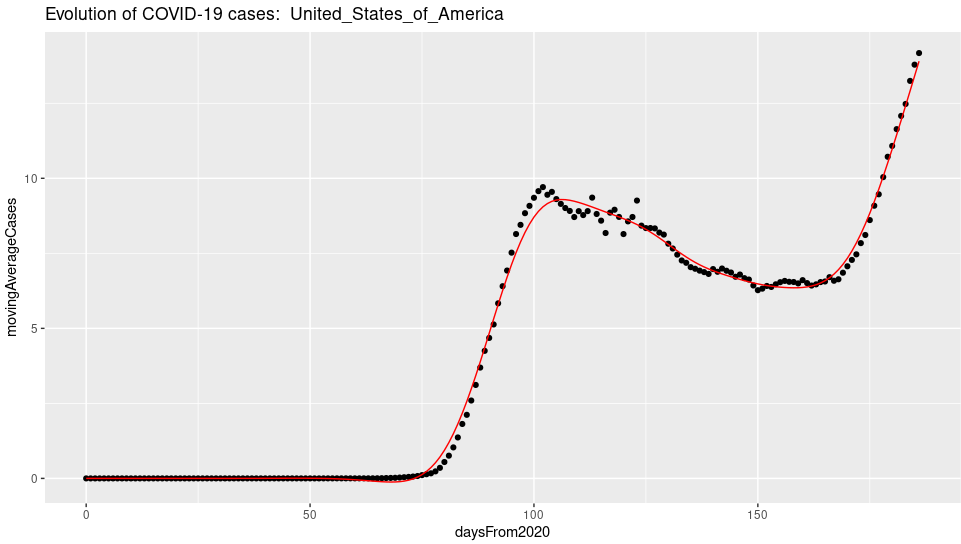
ggplot(covidSubsetByCountry, aes(daysFrom2020, movingAverageCases) ) +
geom_point() + geom_line(data=spCases,aes(x,y),color = "red") + ggtitle(paste("Evolution of COVID-19 cases: " ,countrySelected))
ggplot(covidSubsetByCountry, aes(daysFrom2020, movingAverageDeaths) ) +
geom_point() + geom_line(data=spDeaths,aes(x,y),color = "red") + ggtitle(paste("Evolution of COVID-19 deaths: ",countrySelected))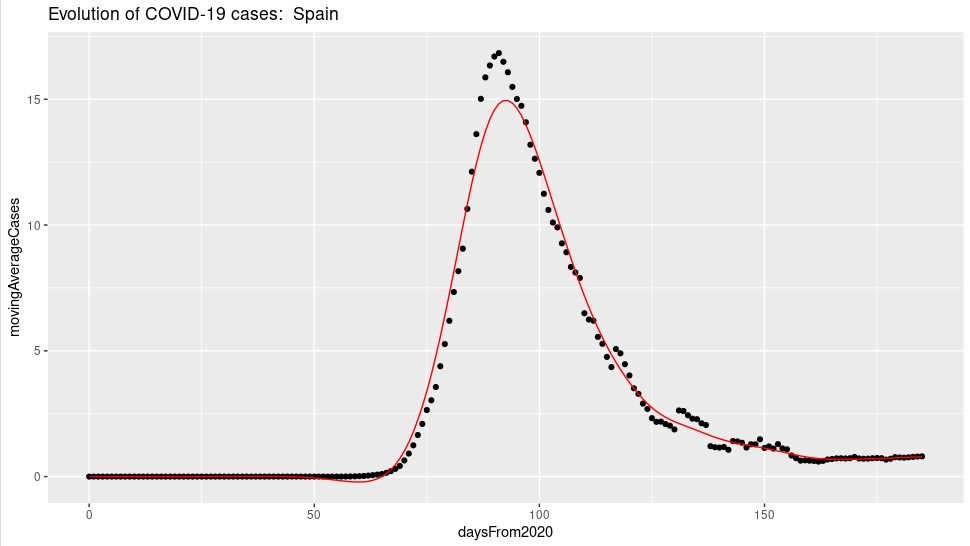
Check out the repo file to download the code.